U.S. Flu Forecasts --- 2010 Week 5 (Produced 4 February)
Regional Influenza Activity for week 5 (ending 6 February)
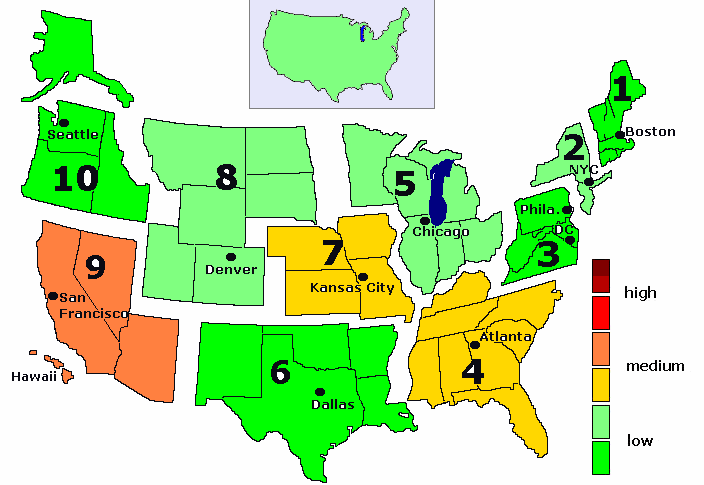
2010 Week 5 (nowcast)
Color coding is based on region-specific baselines. Green and yellow:
below baseline; orange: between baseline and 1.5 times baseline; red:
above 1.5 times baseline; dark red: above 3 times baseline; very dark red:
above 6 times baseline.
1 Summary for Week 5 (Produced 4 February)
The CDC reports in week 3 that the %weighted ILI
(the percentage of outpatient visits for influenza-like illness) stands at 1.7%.
During November, December and the first two weeks of January, flu activity
has been in line with model M2. The small fall from week 2 to 3 is
unusual, happening previously in 2004 and 2000. The reported level for week 3
is lower than any in the previous ten years.
The M2 nowcasts for weeks 4 and 5 of 2010 are 2.0% and 2.2%.
ILI% in the US is below the (old) national baseline of 2.4%.
Flu activity in 1 out of 10 regions is above their region-specific
baseline, based on week 5 nowcasts.
2 Current Influenza Activity
Robustified Google Flu Trend nowcasts (RGFT) shows ILI%
in weeks 4 at 1.7%, followed by 1.7% in week 5.
This uses the current GFT data which show 1.9 and 1.8% respectively.
RGFT is based on the changes in the logit of Google Flu Trends (GFT),
applied to the ILI% level reported in the CDC influenza report for week 3.
The rapid growth of weeks 33-35 is very well described by the
addition of a local linear trend to model M2: the logit increased by
0.2, 0.4, 0.6 respectively.
This corresponds approximately with increases of 20%, 40% and 60% in
flu activity (ILI%). Week 36 shows a slower increase at 0.3 and week 37 at 0.1.
Week 38 had a sudden decline which matched the model, corresponding
to a zero in the trend. However, week 39 is back to a 20% increase
over the model, and weeks 40,41 show 40%. Finally, week 42 has a 30%
increase above normal, and week 43 has 20%.
In comparison, during the winter peak in a normal flu season (weeks 50-51 and 3-6),
there is an average weekly increase of about 20%.
The nowcasts make the assumption that the trend follows a 1,2,3,1.5,0.5,0,1,2,2,1.5,1
pattern (multiplied by the estimated coefficient of 0.2) for
weeks 33-43. Flu activity has been in line with model M2 from week 44 to 50.
Model M2 nowcasts, based on this trend (i.e. trend up to week 43,
then normal behavior from week 44 onwards), reports
ILI% levels at
2.0% for week 4 and 2.2% for week 5.
The average nowcasts for week 4 and 5, based on pooling a dynamic model with
calendar effects (M2) and RGFT, show ILI% of
1.9% and 1.9% respectively.
3 Expected Influenza Activity
Historically, there tends to be an increase in ILI% in the last three weeks of the year,
and then again from week 3 to 6 in the new year. This amounts to 20% each week.
4 Flu Season Forecasts of Influenza Activity
The scenarios have not been updated, and are as in the week 38 report.
The dynamic model M2 describes normal flu seasons quite well, but is
inappropriate during pandemic flu. For that reason, scenarios are reported.
The one-year ahead forecasts use
the average nowcasts for week 37 and 38 as the starting point for forecasting.
Then three assumptions are used to capture pandemic flu activity:
Medium 20%: the period of elevated activity lasts until Thanksgiving Day.
This is captured by a trend effect estimated over weeks 33 to 37
which is increasing until week 35 then decreasing. From week 38
until Thanksgiving Day 0.2 is added to the intercept (a 20% increase in ILI).
This is the dotted blue line.
Note that Thanksgiving Day is usually associated with an increase in flu activity.
Long 20%: the period of elevated activity is extended until the week
before Christmas, the solid blu line.
Long 25%: the coefficient is increased from 0.2 to 0.25, and runs
until the week before Christmas (the dotted purple line).
Note that the dynamics in the model effectuates a moderating effect
after a longer period of very rapid increase.
If these assumptions hold, very high levels of ILI% should be expected.
The results reported here are based on forecast, and
are therefore uncertain. These results are my personal opinion, based on extensive
modeling, and not endorsed by either the CDC or Google.